The Dashboard is your project's home page: the place where you check, at a glance, how the RSVP is going. Open it from the sidebar, or just open your project; it's the first thing you land on.
Right after creating a project you'll see a setup screen here instead: first the activation notice, then the "Set up your project" checklist. The dashboard described below appears once your project is active and has at least one guest and one question. See Creating your first project for that phase.
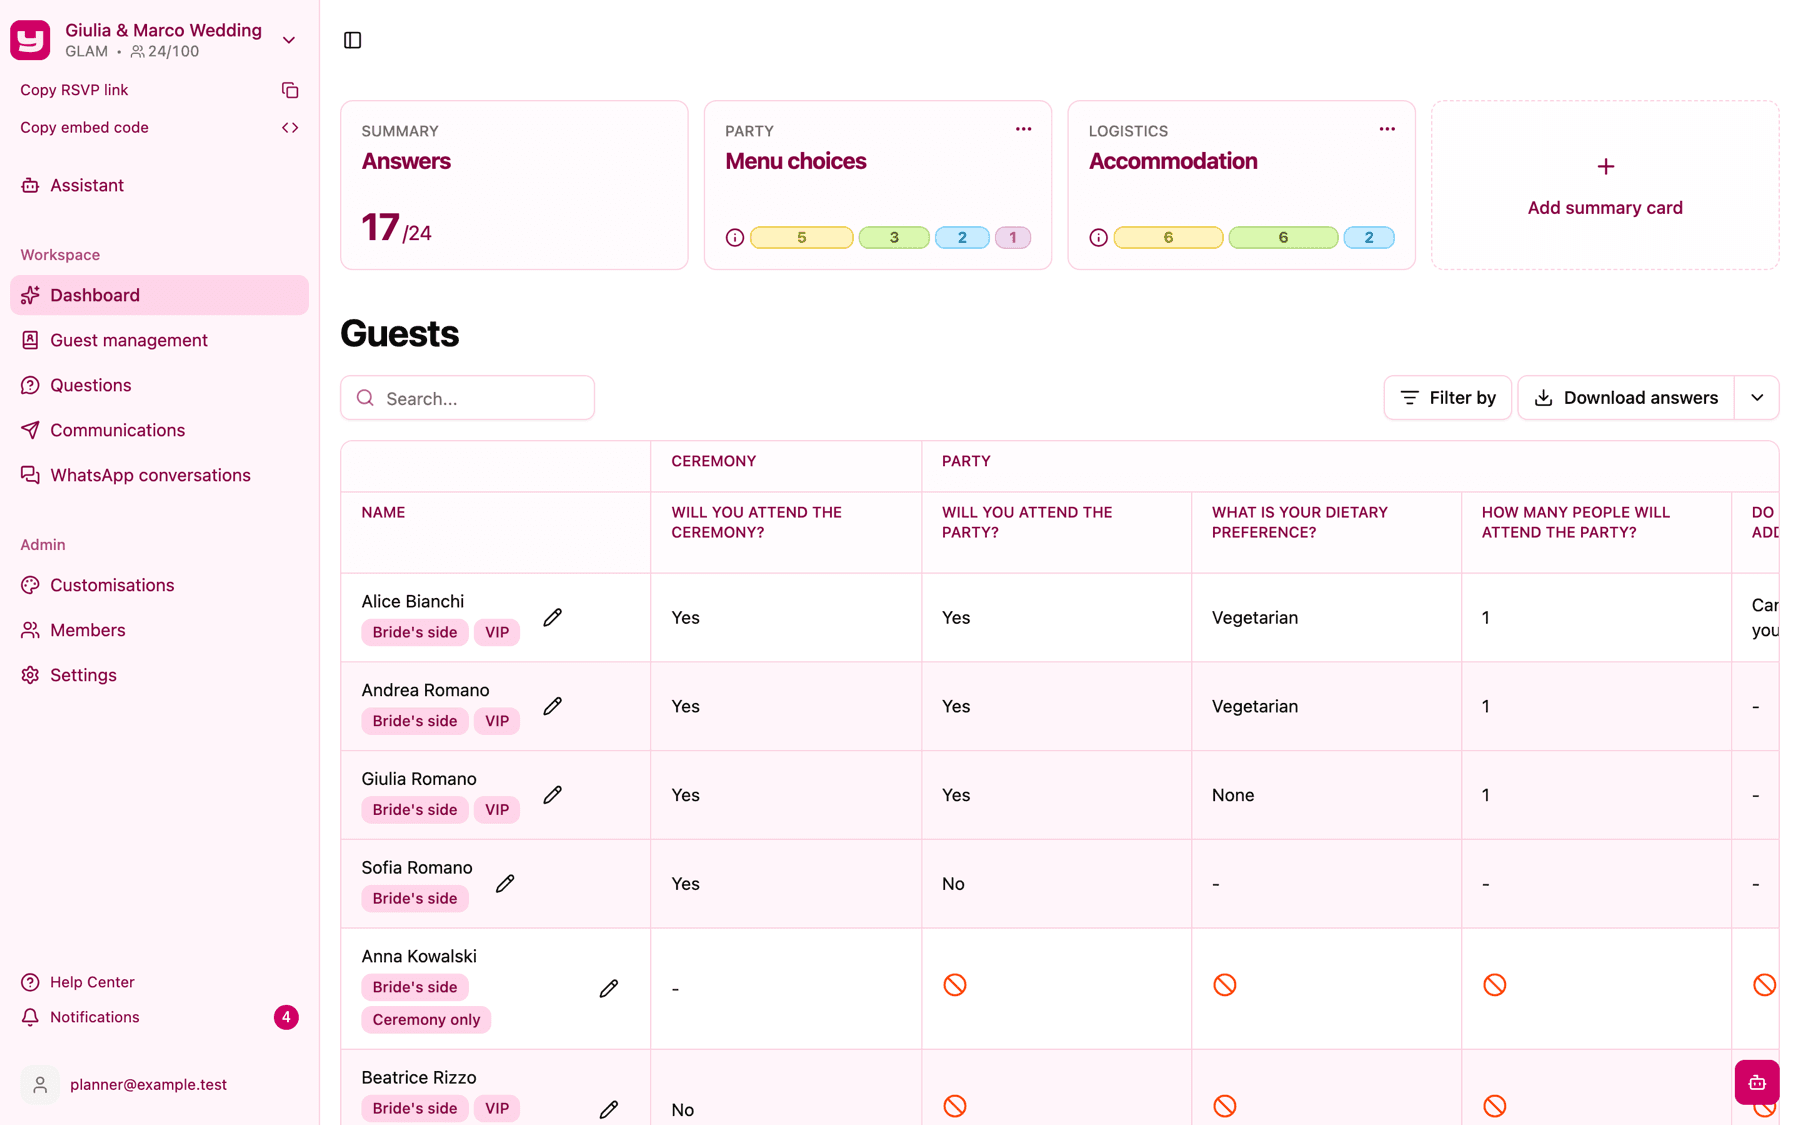
The cards at the top
The first row of the dashboard is a set of cards.
The Answers card is always there, and it answers the most important question of all: how many guests have replied so far, shown as a number like 54/120 (54 of your 120 guests have completed the survey). If you're getting close to your plan's guest limit, or you've reached it, a warning icon appears here too: hover over it to see how many guests you've used (see What to do when you need more guests).
Summary cards come next: optional cards that each track one question of your survey, showing its most popular answers as a proportional bar. They're your way to keep the answers you care about most (menu choices, transport needs) always in sight. Click one to open a detailed view with a chart and the full list of who answered what. Admins can add as many as they like with the Add summary card tile; the full walkthrough is in Setting up a summary card.
The guest report table
Below the cards sits the heart of the dashboard: a table with one row per guest and one column per question, with question columns grouped under the event they belong to. This is where you look up any specific answer.
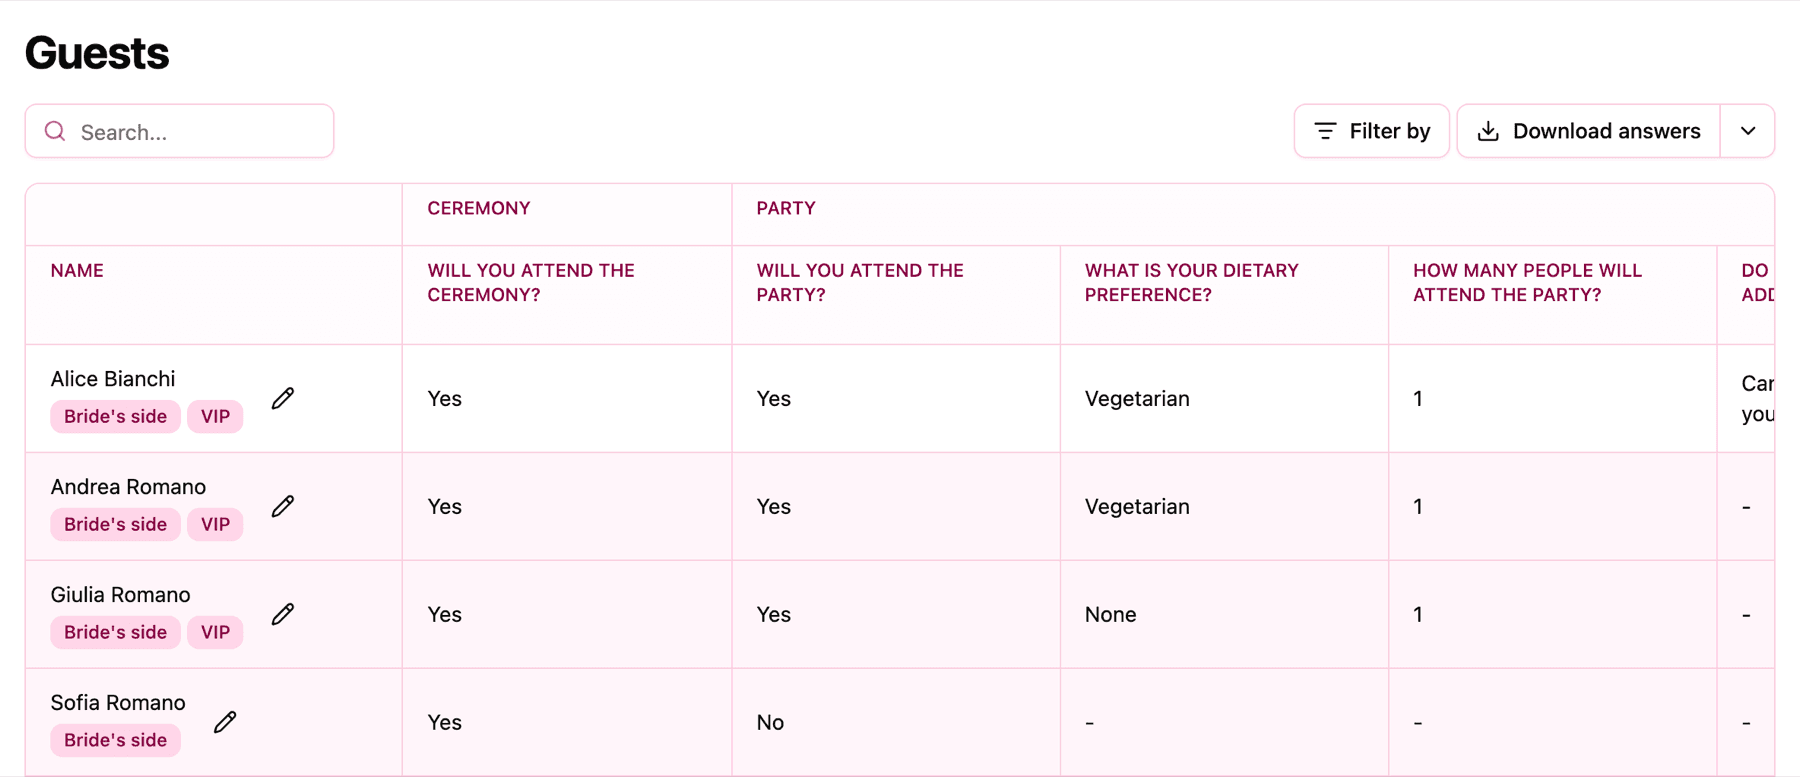
A few things worth knowing:
- Search and filters. The search box finds guests by name; the Filter by button narrows the table by tags or by answers to any question, including "Answered" and "Not Answered". Filtering by "Not Answered" on the attendance question, for example, gives you the exact list of people to remind.
- Guests stay grouped. Guests that belong to the same group (a family, a couple) are kept together in the table, and their tags appear under their names.
- The "no entry" icon in a cell means that guest isn't invited to that event, so they'll never see that question.
- The pencil next to a guest's name (Admins only) lets you answer the survey on their behalf. This is the tool for grandparents who RSVP by phone: their answer ends up in the same place as everyone else's.
- The download buttons in the table's header export every response as an Excel or CSV file; see Downloading your guests' responses.
Who sees what
Everyone who is a member of the project can view the dashboard, open summary card details, and download the responses. Adding or removing summary cards and answering on behalf of a guest are reserved for Admins.